When you don't have any licencing tools like OEM, To get more information about system typically takes time and it is difficult to show in single dash-board or via graphs. So here I will take few tools name what I discovered during my research. These tools are developed by somebody and kept in GitHub. Thought this page, I am not claiming any thing that is developed or modified by me. Thanks to them who really developed those and kept in GitHub for us to make our DBAs life easy. Here are some tools what can help you:
A) TUNAS360 ( TUNing Active Sessions)
B) eDB360 & SqlDB360
C) snapper
D) Trace Analyze Tool
These above tools are free and but you should have licence of Enterprise Edition with Tuning and Diagnostic Pack. You are sole responsible to execute of scripts. Neither I am the owner of script not I can give you any solution if any damage happen post run. But I have not faced any issue with these tools. Even I have not seen any claim in sites.
A) TUNAS360 ( TUNing Active Sessions):
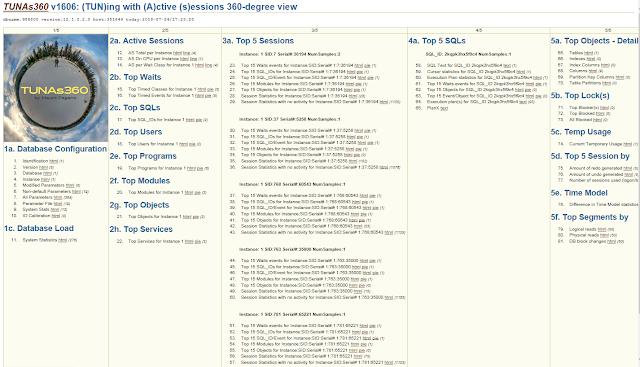
(TUN)ing with (A)ctive (s)essions, aka TUNAs360, requires no installation and no parameter when executed; it observes the workload for few minutes and then collects a set of reports on such load.
Mauro Pagano descried about his tool. Please click here to read more.
Steps to use:
1. Unzip tunas360-master.zip, navigate to the root tunas360 directory, and connect as SYS,
DBA, or any User with Data Dictionary access: Click here to download script.
$ unzip tunas360-master.zip
$ cd tunas360-master
$ sqlplus dba_user/dba_pwd
2. Execute tunas360.sql passing no parameters. TUNAs360 will observe the workload for a few minutes and it will then report on such workload
SQL> @tunas360.sql
3. Unzip output tunas360_<dbname>_<host>_YYYYMMDD_HH24MI.zip into a directory on your PC
4. Review main html file 0001_tunas360_<dbname>_index.html
Sample Screen-shot:
B) SQLdb360 ( Just like SQLT)SQLdb360 is a "free to use toolset" to perform an initial assessment of an entire Oracle database or a particular SQL statement.SQLdb360 is made of two independent tools, eDB360 (database-wide analysis) and SQLd360 (individual SQL analysis). Steps To use:1. Download the tool into target database server2. Navigate to master directory and connect into SQLPlus as DBA or user with access to data dictionary3. Execute edb360.sql (database view) of sqld360.sql (one SQL focus) - Both tools will prompt for the license available on the target database. - [T | D | N] For Tuning, Diagnostics or None - Both tools accept an optimal configuration file - SQLd360 requires the SQL ID of interest to be provided 4. Copy output zip to client (PC or Mac), unzip and open in browser file 00001_*_index.htmlNotes:1. eDB360 and SQLd360 run transparently on and support RAC, Exadata and In-Memory. In a multitenant environment, connect to PDB of interest.2. No application data is collected, only metadata is accessed.3. Both tools work in a "no evidence left behind" fashion, meaning there is no post execution step that needs to be executed, the tools clean after themselves.4. It is recommended to download the latest version of the tool before using it, this is to minimize the impact of known bugs and benefit from latest features.Troubleshootingedb360 takes up to 24 hours to execute on a large database. But option-wise, it may complete within few minutes. On smaller ones or on Exadata it may take a few hours or less. In rare cases it may require even more than 24 hrs. By default, eDB360 executes a pre-check and asks for confirmation in case the execution is estimated to take more than 8 hours. Multiple options are available to speed up large executions, for details click here to refer as per the site.SQLd360 is generally faster, given the reduced scope, and as such no pre-check is executed.Sample Example:( To Trace and get details analysis report of a sql_id)$ unzip sqld360-master.zip$ cd sqld360-master$ sqlplus / as sysdbaSQL> @sqld360.sql 18nu9mw27r4dm TSQLd360 usually completes within a few minutes but it can take longer in case the amount of data to analyze in AWR/ASH is significant. The output file can reach up to 100Mb so make sure the directory where the tool is executed from has enough free space.Following .zip file will be created. sqld360_986800_18nu9mw27r4dm_351649_20180725_1516.zipUnzip and open the index file and go through the options. Beauty of this is, it also give you 10053 trace file including query, execution plan etc.
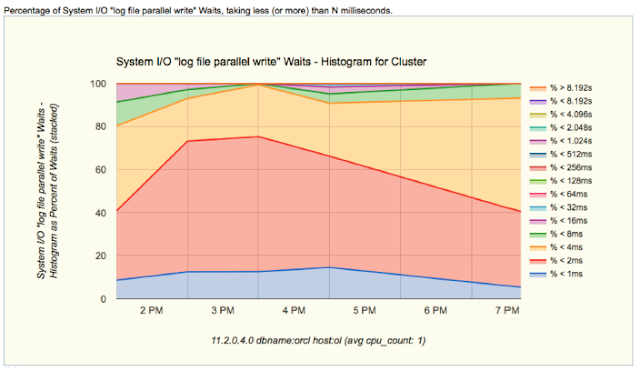
Another Sample screen-shot with other options:
C) SNAPPER:As the Snapper script allows you to easily take performance snapshots of Oracle sessions and fish for solutions to your performance problems from the ocean of possible root causes. The major new features include:- RAC support – ability to query stats from remote instances- Manual Before and After snapshot support – no need to use DBMS_LOCK sleeps anymoreShow useful averages and ratios *in addition to* raw metrics for faster troubleshootingAnd more! :)Snapper is still a free-to-use tool and it still does NOT require any object creation nor changes in your databases for use. Now even DBMS_LOCK access isn’t needed, although it’s still useful for convenience. Click here to find script location.Sample Examples:1) Test-1:SQL> @snapper ash 5 1 all
mode can be ash, stat or custom column list– seconds to run/sample– number of runs– “all” or filter on v$session columnsSimilarly, you can use bellow also. In the script syntax is written. Test-2:SQL> @snapper ash=wait_class 5 1 allSampling SID all with interval 5 seconds, taking 1 snapshots...Test-3:SQL> @snapper stats,gather=tw 15 1 sid=802Sampling SID sid=802 with interval 15 seconds, taking 1 snapshots... Test-4:SQL> @snapper ash=sql_id+wait_class 15 1 user=scottSampling SID user=scott with interval 15 seconds, taking 1 snapshots...
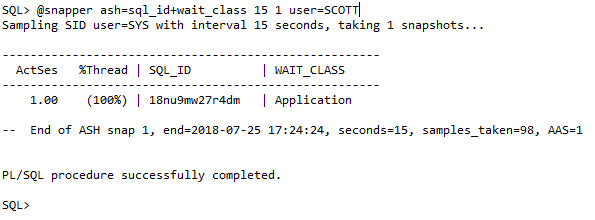 Other Examples:@snapper ash=sid+event+wait_class,ash1=plsql_object_id+plsql_subprogram_id+sql_id,ash2=program+module+action 5 1 all@snapper ash=sid+event+wait_class,ash1=sid+sqlid+module,stats,gather=ts,tinclude=CPU,sinclude=parse 5 1 14167@snapper stats 5 1 14074@snapper ash,stats 50 1 795
Note: 14167, 14074 etc. are oracle trace types.
D) Trace Analyze Tool ( Oracle Trace Parsing):When you are tracing session, if you have analyze tool, then you can easily find out the root cause. Oracle has trace analyzer. Even some free tools are there. I found this tool good enough for me during sql trace.
To download script, click here.How to use?steps:1) Dowmload the script and unzip2) Go the script folder3) Run as like below:$ ./parsetrc.pl mytrace.trc( taken from readme.txt)
A) TUNAS360 ( TUNing Active Sessions)
B) eDB360 & SqlDB360
C) snapper
D) Trace Analyze Tool
These above tools are free and but you should have licence of Enterprise Edition with Tuning and Diagnostic Pack. You are sole responsible to execute of scripts. Neither I am the owner of script not I can give you any solution if any damage happen post run. But I have not faced any issue with these tools. Even I have not seen any claim in sites.
A) TUNAS360 ( TUNing Active Sessions):
(TUN)ing with (A)ctive (s)essions, aka TUNAs360, requires no installation and no parameter when executed; it observes the workload for few minutes and then collects a set of reports on such load.
Mauro Pagano descried about his tool. Please click here to read more.
Steps to use:
1. Unzip tunas360-master.zip, navigate to the root tunas360 directory, and connect as SYS,
DBA, or any User with Data Dictionary access: Click here to download script.
$ unzip tunas360-master.zip
$ cd tunas360-master
$ sqlplus dba_user/dba_pwd
2. Execute tunas360.sql passing no parameters. TUNAs360 will observe the workload for a few minutes and it will then report on such workload
SQL> @tunas360.sql
3. Unzip output tunas360_<dbname>_<host>_YYYYMMDD_HH24MI.zip into a directory on your PC
4. Review main html file 0001_tunas360_<dbname>_index.html
Sample Screen-shot:

B) SQLdb360 ( Just like SQLT)SQLdb360 is a "free to use toolset" to perform an initial assessment of an entire Oracle database or a particular SQL statement.SQLdb360 is made of two independent tools, eDB360 (database-wide analysis) and SQLd360 (individual SQL analysis). Steps To use:1. Download the tool into target database server2. Navigate to master directory and connect into SQLPlus as DBA or user with access to data dictionary3. Execute edb360.sql (database view) of sqld360.sql (one SQL focus) - Both tools will prompt for the license available on the target database. - [T | D | N] For Tuning, Diagnostics or None - Both tools accept an optimal configuration file - SQLd360 requires the SQL ID of interest to be provided 4. Copy output zip to client (PC or Mac), unzip and open in browser file 00001_*_index.htmlNotes:1. eDB360 and SQLd360 run transparently on and support RAC, Exadata and In-Memory. In a multitenant environment, connect to PDB of interest.2. No application data is collected, only metadata is accessed.3. Both tools work in a "no evidence left behind" fashion, meaning there is no post execution step that needs to be executed, the tools clean after themselves.4. It is recommended to download the latest version of the tool before using it, this is to minimize the impact of known bugs and benefit from latest features.Troubleshootingedb360 takes up to 24 hours to execute on a large database. But option-wise, it may complete within few minutes. On smaller ones or on Exadata it may take a few hours or less. In rare cases it may require even more than 24 hrs. By default, eDB360 executes a pre-check and asks for confirmation in case the execution is estimated to take more than 8 hours. Multiple options are available to speed up large executions, for details click here to refer as per the site.SQLd360 is generally faster, given the reduced scope, and as such no pre-check is executed.Sample Example:( To Trace and get details analysis report of a sql_id)$ unzip sqld360-master.zip$ cd sqld360-master$ sqlplus / as sysdbaSQL> @sqld360.sql 18nu9mw27r4dm TSQLd360 usually completes within a few minutes but it can take longer in case the amount of data to analyze in AWR/ASH is significant. The output file can reach up to 100Mb so make sure the directory where the tool is executed from has enough free space.Following .zip file will be created. sqld360_986800_18nu9mw27r4dm_351649_20180725_1516.zipUnzip and open the index file and go through the options. Beauty of this is, it also give you 10053 trace file including query, execution plan etc.
Another Sample screen-shot with other options:
C) SNAPPER:As the Snapper script allows you to easily take performance snapshots of Oracle sessions and fish for solutions to your performance problems from the ocean of possible root causes. The major new features include:- RAC support – ability to query stats from remote instances- Manual Before and After snapshot support – no need to use DBMS_LOCK sleeps anymoreShow useful averages and ratios *in addition to* raw metrics for faster troubleshootingAnd more! :)Snapper is still a free-to-use tool and it still does NOT require any object creation nor changes in your databases for use. Now even DBMS_LOCK access isn’t needed, although it’s still useful for convenience. Click here to find script location.Sample Examples:1) Test-1:SQL> @snapper ash 5 1 all
mode can be ash, stat or custom column list– seconds to run/sample– number of runs– “all” or filter on v$session columnsSimilarly, you can use bellow also. In the script syntax is written. Test-2:SQL> @snapper ash=wait_class 5 1 allSampling SID all with interval 5 seconds, taking 1 snapshots...Test-3:SQL> @snapper stats,gather=tw 15 1 sid=802Sampling SID sid=802 with interval 15 seconds, taking 1 snapshots...
 Test-4:SQL> @snapper ash=sql_id+wait_class 15 1 user=scottSampling SID user=scott with interval 15 seconds, taking 1 snapshots...
 Other Examples:@snapper ash=sid+event+wait_class,ash1=plsql_object_id+plsql_subprogram_id+sql_id,ash2=program+module+action 5 1 all@snapper ash=sid+event+wait_class,ash1=sid+sqlid+module,stats,gather=ts,tinclude=CPU,sinclude=parse 5 1 14167@snapper stats 5 1 14074@snapper ash,stats 50 1 795
Note: 14167, 14074 etc. are oracle trace types.
To download script, click here.How to use?steps:1) Dowmload the script and unzip2) Go the script folder3) Run as like below:$ ./parsetrc.pl mytrace.trc( taken from readme.txt)



Thank you for this awesome post. This is what I was looking for.
ReplyDeleteOracle DBA training |
Oracle course in Chennai |
oracle institute in chennai |
best oracle training institute in chennai |
Such a great blog.Thanks for sharing.........
ReplyDeleteCyber Security Course in Pune
Cyber Security Course in Gurgaon
Cyber Security Course in Hyderabad
Cyber Security Course in Bangalore
This comment has been removed by a blog administrator.
ReplyDeleteThis comment has been removed by a blog administrator.
ReplyDeleteCyber Security Course in Mumbai
ReplyDeleteCyber Security Course in Ahmedabad
Cyber Security Course in Kochi
Cyber Security Course in Trivandrum
Cyber Security Course in Kolkata
The Growing Imporance of Cyber Security Analytics
This comment has been removed by a blog administrator.
ReplyDelete