Grfana Dashboard setup(Part-1)
Here we can continue to setup grafana. so that we can have stunning visualizations of Prometheus server data collection.
For my lab setup, I shall use same Prometheus server for grafana setup. But you can use different server also in real case scenario.
Go to grafana official website
https://grafana.com/ --> Downloads --> Self-managed --> select Grafana --> Download --> select (OSS) Open source softwae --> select Linux version
[root@grafana ec2-user]# mkdir grafana
[root@grafana ec2-user]# cd grafana/
[root@grafana grafana]# pwd
/home/ec2-user/grafana
# wget https://dl.grafana.com/oss/release/grafana-9.4.7-1.x86_64.rpm
# sudo yum install grafana-9.4.7-1.x86_64.rpm
[root@grafana grafana]# service grafana-server restart
Restarting grafana-server (via systemctl): [ OK ]
-- Enable always on for both grafana and Prometheus
[root@grafana grafana]# chkconfig grafana-server on
[root@grafana grafana]# systemctl enable prometheus.service
-- in targets/ nodes also enable node exporter
[root@target node_exporter]# systemctl enable node_exporter.service
Note: Grafana runs on default 3000 port. make sure this port allowed in security group.
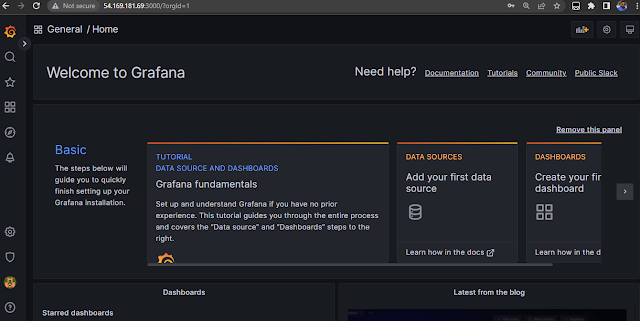
Now open grafana URL.
http://54.169.181.69:300
It ll ask you username and password. By default username and password will be "admin".
As soon as you logged in, it ll prompt you to change password:
Now you need to configure data source.. Grafana support lots of data sources:
select Configuration --> Data source
Now add prmotheus data souce like below:
URL: http://<private-ip>:9090/
Then "save & Test". You can see message like "Data souce is working". If error need to check whether IP address used wrongly etc.
Now create your dashboard:
Select Dash board --> New Dash board --> New Panel
Now you need to choose data source. Here we have only Prometheus data source as of now.
then, use same PromoQL. for that select "Code" and use the query and click on "Run queries"
Here is my first dashboard. You can give name to this panel also. You can create many panels and dashboards as per your requirements.


No comments:
Post a Comment