About Metric Extensions:
Metric extensions provide you with the ability to extend Oracle's monitoring capabilities to monitor conditions specific to your IT environment. This provides you with a comprehensive view of your environment. Furthermore, metric extensions allow you to simplify your IT organization's operational processes by leveraging Enterprise Manager as the single central monitoring tool for your entire data-center instead of relying on other monitoring tools to provide this supplementary monitoring.
Creating a Custom Metric Extension:
By default Oracle has multiple metrics to monitor and report the system. But as per your need you can create your own metric to monitor and both monitor and corrective actions. This is the existing feature of OEM to customize / create your own metrics using Metric Extension. These are metrics you want to track that may or may not be provided with the underlying products. I want to illustrate this point one of requirement on using Oracle Enterprise Manager with Oracle Utilities products.
Requirement:
Suppose there is common admin account in all your database targets with sysdba previllege and to monitor, deploy and all database activities are taken care using this common account via a named credential. If you business need a report on daily basis of audit report of that all the activities using that names credential or account.
How to create Named Credential?
Let us proceed with the requirements ...
Here are the consolidated steps to create custom metric extension and generate audit report:
Step-1: Create Metric Extension
Step-2: Deploy to Target
Step-3: Publish Metric Extension
Step-4: Create Information Publisher Report
A couple of things before we start:
Example: To Create SYSADMIN manually in all Targets
Connect to each target and run the below script:
create user SYSADMIN identified by <password> default tablespace users profile default;
grant connect, resource to SYSADMIN;
grant sysdba to SYSADMIN;
Assume these accounts has been created multiple targets. To deply to multiple targets, you can create a shell script and via OEM job you can deploy to many database targets. For testing let us say these targets are : TESTDB1, TESTDB2 etc.
Create Global Named Credential for this account ( using GUI)

.
Note that all targets are 12c with Unified audit enabled. DB level data can be captured for SYSDBA accounts when database is in 12c.
Enable audit for SYSADMIN account in all the targets:
e.g.,
SQL> audit all by SYSADMIN by access;
Audit succeeded.
Here we can proceed with all our steps.
Step-1: Create Metric Extension:


Use default credentail. But you need to give below access to DBSNMP account:
-- on all target
SQL> grant select on unified_audit_trail to dbsnmp;
Grant succeeded.
SQL> grant select any dictionary to dbsnmp;
Grant succeeded.
Then, you cam move to next step with "Next". In the next scree, You can attach a database and run the test to verify the metric. This does not attach the metric to the target. It just tests it. Use (+Add) to add a database target and then Use “Run Test”.

Now Click on Run Test. If you are getting results without error, then it is fine to proceed with next steps. Otherwise you need to fix the issues. May be you used semi-column (;) symbol at end of the query or may be you have not used any key column etc.


after adding number of targets, then "submit" to deploy. Here you can select groups also.
Here you will have below screen when you deployed the ME into multiple targets.

If we will search your metric extension, then you will find no. of deployed targets 2. Because we have deployed to two targets as per our above screen.
Here we completed two steps. First is Creation of ME and second is deployment of ME to database targets. Here we can move to next step to publish ME.
Step-3: Publish Metric Extension (ME)
 Now, our ME published. Now data will be captured by ME. Next step and the last step is reporting.
You Information publisher report to generate report from OMS. Use below sample query to generate report from the newly created metric Extension (ME).
SELECT target_name "DatabaseName",
Key_Value "Time Stamp",
MAX (CASE WHEN COLUMN_LABEL = 'dbuserame' THEN VALUE ELSE NULL END)
"DbUserName",
MAX (CASE WHEN COLUMN_LABEL = 'userhost' THEN VALUE ELSE NULL END)
"UserHost",
MAX (CASE WHEN COLUMN_LABEL = 'USER_NAME' THEN VALUE ELSE NULL END)
"OemUserName",
MAX (CASE WHEN COLUMN_LABEL = 'USER_IP' THEN VALUE ELSE NULL END)
"UserIP",
MAX (CASE WHEN COLUMN_LABEL = 'object_schema' THEN VALUE ELSE NULL END)
"SchemaName",
MAX (CASE WHEN COLUMN_LABEL = 'object_name' THEN VALUE ELSE NULL END)
"ObjectName",
MAX (CASE WHEN COLUMN_LABEL = 'action_name' THEN VALUE ELSE NULL END)
"ActionPeformed"
FROM SYSMAN.mgmt$metric_details
WHERE metric_name = 'ME$SYSADMIN_AUDIT_TRAIL'
GROUP BY target_name, key_value
order by 1,2 desc,5,6,7,8
/
Thank you!
Metric extensions provide you with the ability to extend Oracle's monitoring capabilities to monitor conditions specific to your IT environment. This provides you with a comprehensive view of your environment. Furthermore, metric extensions allow you to simplify your IT organization's operational processes by leveraging Enterprise Manager as the single central monitoring tool for your entire data-center instead of relying on other monitoring tools to provide this supplementary monitoring.
Creating a Custom Metric Extension:
By default Oracle has multiple metrics to monitor and report the system. But as per your need you can create your own metric to monitor and both monitor and corrective actions. This is the existing feature of OEM to customize / create your own metrics using Metric Extension. These are metrics you want to track that may or may not be provided with the underlying products. I want to illustrate this point one of requirement on using Oracle Enterprise Manager with Oracle Utilities products.
Requirement:
Suppose there is common admin account in all your database targets with sysdba previllege and to monitor, deploy and all database activities are taken care using this common account via a named credential. If you business need a report on daily basis of audit report of that all the activities using that names credential or account.
How to create Named Credential?
Let us proceed with the requirements ...
Here are the consolidated steps to create custom metric extension and generate audit report:
Step-1: Create Metric Extension
Step-2: Deploy to Target
Step-3: Publish Metric Extension
Step-4: Create Information Publisher Report
A couple of things before we start:
- You need to create common accounts in all targets. You can use OEM job for the same task.
e.g., SYSADMIN - You need to create a Global Named Credential.
e.g., NC_ORACLE_SYSADMIN
Use below EMCLI command to see the above Named Credential is created or not.
$ emcli list -resource=NamedCredentials -columns="CredName,CredOwner" - Test your SQL query what kind of output you need.
Connect to each target and run the below script:
create user SYSADMIN identified by <password> default tablespace users profile default;
grant connect, resource to SYSADMIN;
grant sysdba to SYSADMIN;
Assume these accounts has been created multiple targets. To deply to multiple targets, you can create a shell script and via OEM job you can deploy to many database targets. For testing let us say these targets are : TESTDB1, TESTDB2 etc.
Create Global Named Credential for this account ( using GUI)

.
Note that all targets are 12c with Unified audit enabled. DB level data can be captured for SYSDBA accounts when database is in 12c.
Enable audit for SYSADMIN account in all the targets:
e.g.,
SQL> audit all by SYSADMIN by access;
Audit succeeded.
Example : Sample Query to Test in any Target to verify what type of data you need to push to your metric extension. Assume push data hourly basis.
SELECT to_char(event_timestamp) EVENT_TIMESTAMP,
DBUSERNAME,USERHOST,
REGEXP_SUBSTR(CLIENT_IDENTIFIER, '^[^@]*') USER_NAME,
substr(REGEXP_SUBSTR(CLIENT_IDENTIFIER, '*@[^@]*'),2) USER_IP,
ACTION_NAME, OBJECT_SCHEMA,OBJECT_NAME
FROM unified_audit_trail
WHERE event_timestamp > systimestamp - numtodsinterval(60,'MINUTE')
and dbusername = 'SYSADMIN';
Now. I am doing some activity in TESTDB1 and let us capture the outputs
Sample output:

Sample output:
Note: Tested only one target.
Here we can proceed with all our steps.
Step-1: Create Metric Extension:
Navigate to the Metrics Extension facility. This
can be done from the link page or menu (Monitoring --> Metric
Extensions). For example:
OEM console à Enterprise à Monitoring à Metric Extensions à Create à Metric Extension

From
the Create menu,
Select Metrics
Extension. For example:

Specify the Metric Name, Target Type (Database
Instance in this case), Display Name, Adapter (SQL in
this case), Description and other attributes for the metric
including default collection frequency. For example:
Target Type : database Instance
Enter Metric Name : e.g., SYSADMIN_AUDIT_TRAIL
Collection Frequency : set 1 hour ( with Hourly)
Adapter : SQL

·
You might notice the Select Advanced
Properties which allows you to specify other attributes on the target
to specialize the metric. This is new to OEM 13c and in this case will allow
you to target multi-tenant databases (or not) for example.
·
Now as this is an SQL based metric you need to
specify the SQL statement to execute to gather the data. You can get over this
by making sure the credentials have access to the view or create a synonym.
Remember the database user must have SELECT access as a minimum. The example of
the SQL is shown below:
Click on
“Next”

Add your tested query in the above screen.
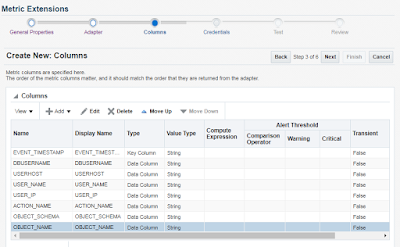
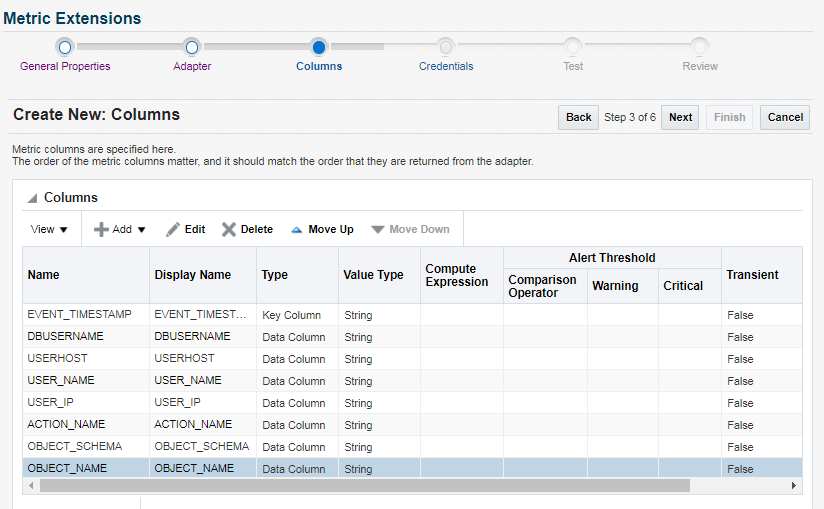
In Next screen add all the columns as metric columns with datatype string. Add EVENT_TIMESTAMP as key column.


Repeat same steps till addition of all the columns with submitting "OK". At last you have following list of columns.
Like wise
add all the columns and display value as per the query.
- For each column in the query you need to define it as part of the Metric. You do not have to define all of them but it is recommended to get full reuse. For each column, defines it attributes including if it data or a key value. Key values are used for SLA tracking. Also you can define more meta data to allow OEM to determine how to process it. The columns for our example are shown below:
- The credentials for the metric need to be defined. When you create a metric you simply attach it to the metrics collection to use it. Again ensure that the credential is valid for the query. In my example I will use the standard database monitoring credential. For example:

Use default credentail. But you need to give below access to DBSNMP account:
-- on all target
SQL> grant select on unified_audit_trail to dbsnmp;
Grant succeeded.
SQL> grant select any dictionary to dbsnmp;
Grant succeeded.
Then, you cam move to next step with "Next". In the next scree, You can attach a database and run the test to verify the metric. This does not attach the metric to the target. It just tests it. Use (+Add) to add a database target and then Use “Run Test”.
When script
is in execution mode:

Now Click on Run Test. If you are getting results without error, then it is fine to proceed with next steps. Otherwise you need to fix the issues. May be you used semi-column (;) symbol at end of the query or may be you have not used any key column etc.
Click on “Next”. Review before saving the metric. At any
time you can change the metric before you publish it.

Now the metric is still in editable mode so can be edited as
much as necessary. This is indicated on the metric screen. For example:

Here we completed creation of metric Extension. But the ME is now in Editable mode. You cam modify if you feel to alter something. But once it is deployed, then it will create a version and same version can be altered. Now we cam move to next step to deploy the ME in our required database targets.
Step-2: Deploy Metric Extension (ME) to Target(s)
When you
created Metric Extension, this is an editable version. You need to deploy to one or
more targets to create a deployable version. As soon as ME created, you can see
below status for your ME
Steps to
Deploy Targets:
1) OEM
console à
Enterprise à
Monitoring à
Metric Extensions à
Select the ME
2) Action à Save as Deployable
Draft (Now status is changed to Deployable draft)
3) Action à Deploy to Targets (
Here you need to add your required targets using “+Add”)

after adding number of targets, then "submit" to deploy. Here you can select groups also.
Here you will have below screen when you deployed the ME into multiple targets.
4) Now add
one or more databases Targets. E.g.,

If we will search your metric extension, then you will find no. of deployed targets 2. Because we have deployed to two targets as per our above screen.
Here we completed two steps. First is Creation of ME and second is deployment of ME to database targets. Here we can move to next step to publish ME.
Step-3: Publish Metric Extension (ME)
When you
have deployable edition of Metric Extension, then you can publish it to make an
effective.
Follow below
steps to publish the ME.
Steps to
Deploy Targets:
1) OEM
console à
Enterprise à
Monitoring à
Metric Extensions à
Select the ME
2) Action à Publish Metric
Extension (Now status is changed to Published)
You Information publisher report to generate report from OMS. Use below sample query to generate report from the newly created metric Extension (ME).
SELECT target_name "DatabaseName",
Key_Value "Time Stamp",
MAX (CASE WHEN COLUMN_LABEL = 'dbuserame' THEN VALUE ELSE NULL END)
"DbUserName",
MAX (CASE WHEN COLUMN_LABEL = 'userhost' THEN VALUE ELSE NULL END)
"UserHost",
MAX (CASE WHEN COLUMN_LABEL = 'USER_NAME' THEN VALUE ELSE NULL END)
"OemUserName",
MAX (CASE WHEN COLUMN_LABEL = 'USER_IP' THEN VALUE ELSE NULL END)
"UserIP",
MAX (CASE WHEN COLUMN_LABEL = 'object_schema' THEN VALUE ELSE NULL END)
"SchemaName",
MAX (CASE WHEN COLUMN_LABEL = 'object_name' THEN VALUE ELSE NULL END)
"ObjectName",
MAX (CASE WHEN COLUMN_LABEL = 'action_name' THEN VALUE ELSE NULL END)
"ActionPeformed"
FROM SYSMAN.mgmt$metric_details
WHERE metric_name = 'ME$SYSADMIN_AUDIT_TRAIL'
GROUP BY target_name, key_value
order by 1,2 desc,5,6,7,8
/
Click Here to use Information publisher report.
Put your comments.
Thank you!
This comment has been removed by a blog administrator.
ReplyDeleteThis comment has been removed by a blog administrator.
ReplyDeleteThis comment has been removed by a blog administrator.
ReplyDeleteI am excited to watch your upcoming posts too. it encourages me to write and i have written on some hs codes. you can check my writings.
ReplyDeleteHS Code 2201|
HS Code 2202|
HS Code 2203|
HS Code 2204|
HS Code 2205|
HS Code 2206|
HS Code 2207|
HS Code 2208|
HS Code 2209|
HS Code 2301
Great Blog you have posted. i appreciate your work. thanks for sharing
ReplyDeleteHS Code 2302|
HS Code 2304|
HS Code 2306|
HS Code 2309|
HS Code 2401|
HS Code 2402|
HS Code 2501|
HS Code 2502|
HS Code 2503|
HS Code 2505
Found your post interesting to read. I cant wait to see your post soon. Good Luck for the upcoming update.This article is really very interesting and effective.
ReplyDeleteHS Code 2924|
HS Code 2925|
HS Code 2926|
HS Code 2927|
HS Code 2929|
HS Code 2930|
HS Code 2931|
HS Code 2932|
HS Code 2933|
HS Code 2934
This comment has been removed by a blog administrator.
ReplyDeleteThis comment has been removed by a blog administrator.
ReplyDeleteThis comment has been removed by a blog administrator.
ReplyDeleteThis comment has been removed by a blog administrator.
ReplyDeleteSuch a beautiful post you have share. I appriciate your work. I will visit your upcoming posts too. Interested can check the given links here. It can help you to find the hs codes of products.
ReplyDeleteHS Code 0806|
HS Code 0808|
HS Code 0809|
HS Code 0810|
HS Code 0812|
HS Code 0813|
HS Code 0901|
HS Code 0902|
HS Code 0904|
Global data gathers all particular data about the products, and those all elegances are more valuable for exchanging. By the export import data trading business increments quickly. Thus, trading information includes all the details about the products that might help in various ways. Get the effective exchange and make your exchanging business undeniable level. Furthermore, get the shipment in universally.
ReplyDeleteBeing a leading export-import data provider, export import data has the complete list of import and export data on its website- export-import data The traders can collect import custom duty India for their products. Along with import duty, one can also know the major exporters and importers, new markets, ports, and many more for the desired commodities.
ReplyDeleteThis comment has been removed by a blog administrator.
ReplyDeleteThis comment has been removed by a blog administrator.
ReplyDeleteThis comment has been removed by a blog administrator.
ReplyDeleteThis comment has been removed by a blog administrator.
ReplyDeleteThis comment has been removed by a blog administrator.
ReplyDelete