Sep 30, 2013

Blocking sessions causing performance issues

Worldwide most of DBAs are facing performance issues in OLTP oracle databases. Basically in Oracle 10g / 11g there are more views to analyze when any performance issue call received. AWR / ADDM reports clearly tell what happen at that time. But it depends snap time set. For immediate troubleshot, few queries can be executed to find issues with database while issue is related to database slowness only.


~ Case-: Find blocking sessions and clearing them

Most of cases, blocking sessions create more more performance issues. Find whether what query is blocking, log on time and type of blocking. If select query is blocking, then collect blocking session id, username and sql_id and follow beloe steps.

-- Find BLOCKING SESSION id
select a.INST_ID,a.sid,a.serial#,a.BLOCKING_SESSION,a.username,a.status,a.schemaname,
a.BLOCKING_SESSION_STATUS,a.program,a.sql_id,a.LOGON_TIME,a.EVENT
from gv$session a 
where BLOCKING_SESSION  IS NOT NULL;

-- Use blocking session id, sql_id and username to kill the session
select inst_id,'alter system kill session ''' || SID || ',' || SERIAL# || ',@'||inst_id ||''' IMMEDIATE;'
from gv$session gg
where username=<blocking_username>  
and gg.SID in(<BLOCKING SESSION id>);

Note: Don't kill Insert/ Update/ Delete queries. Find what type of event you are getting and try to understand the issue and take a decision accordingly.

-- Find query from sql_id

select * from gv$sql where sql_id='sql_id';

Note: Take the killing session queries and run it ( run any one of the node in RAC). Don't use @inst_id in case of stand alone database servers.

Mviews hanging sessions and clearing them

Worldwide most of DBAs are facing performance issues in OLTP oracle databases. Basically in Oracle 10g / 11g there are more views to analyze when any performance issue call received. AWR / ADDM reports clearly tell what happen at that time. But it depends snap time set. For immediate troubleshot, few queries can be executed to find issues with database while issue is related to database slowness only.

Note: Use v$ for stand alone servers and use gv$ for RAC databases.

Case: Mviews hanging sessions and clearing them

Some times refreshing of materialized views may cause the slowness. To find which mviews are refreshing now, below query may used. Killing the mviews session will improve the performance. Some times this issue will come when link between remote database has issue or remote database is high loaded or local database issued with complete refresh for big table etc.

-- To find which mviews are blocking ( along with killing session query) -- In any version of Oracle
select VS.INST_ID,VL.SID||','||VS.SERIAL#,
VS.USERNAME,ao.object_name,
'alter system kill session '''||vl.SID||','||vs.SERIAL#|| ',@'||vs.inst_id ||''' IMMEDIATE;'
  from GV$LOCK VL, Gv$session VS, all_objects ao
 where vl.type = 'JI' and vl.Lmode = 6 and VS.SID=VL.SID
 and VS.INST_ID=VL.inst_id and vl.ID1=ao.object_id;

OR
-- Simple view ( above 10.1.x.x)

select * from v$mvrefresh;

-- Find query from sql_id
select * from gv$sql where sql_id='sql_id';

Note that don't kill any session unless until confirmation from client/ customer and you need to find what exact mview refresh is happening.

Moving Indexes to corresponding Index tablespaces/ different tablespace

~ Moving Indexes ~ 
~ Moving Indexes to corresponding Index tablespaces/  different tablespace

Some times slowness / perfornace issues observed in various OLTP production environments due to residing of indexes in the same tablespace. After separating idexes to different tablespace, we observed good performance. Not only it will boost performance-wise but also easy to maintain once schema objects in one tablespace and indexes in different tablespace.

syntax: ALTER INDEX index_name REBUILD TABLESPACE tablespacename ONLINE;

Caution: Don't move 'BITMAP' or 'DOMAIN' indexes.

-- Applies to:
Any version of Oracle Database ( both RAC/ Non-RAC/ ASM / Non-ASM), No downtime required. Recomended to apply only in off peak-hours.

-- Create Index tablespaces for your application modules

select 'create tablespace ' || d.username ||
       '_INDEX datafile 'u02/oradata/datafile/' || d.username || '_INDEX_01'''||' size 100M autoextend on; '
from dba_users d
where d.username in('HR','CRM','PAYROLL','SHIPPING');

Note: Add your require schema.

-- Create script move indexes to newly created tablespaces

SQL>SELECT 'ALTER INDEX ' || ai.owner || '.' || ai.index_name ||
        ' rebuild tablespace '|| ai.owner||'_INDEX online;'
FROM ALL_INDEXES ai
WHERE  ai.index_type not in ('BITMAP','DOMAIN')
AND OWNER IN ('HR','CRM','PAYROLL','SHIPPING');

-- Confirmation of Move

SQL> select owner,tablespace_name,count(1)
from all_indexes
WHERE OWNER IN ('HR','CRM','PAYROLL','SHIPPING');

Note: Keep on checking status of no. of Index moved to corresponding tablespaces.
Use SQLDEVELPOR / TOAD / PLSQL developer tool to collect sample queries to run. Other-wise follow below methods:
set echo off;
set heading off;
set lines 180;
set pages 500;    etc.
Hope this document will definitely help.

Thanks
DBAsh.........njy.........

Sep 29, 2013

Case Sensitive issue while login

~ Case Sensitive issue while login

-- Default case sensitive in Oracle 11g
-- Reset case sensitive

In Oracle 11g ( above version 11.1.x.x), default case sensitive os ON, i.e., applies as it is password set with proper case. To make case sensitive flse, following steps can be followed.

-- To check/ verify what is the parameter value.
$ sqlplus / as sysdba
SQL>
SQL> SHOW PARAMETER SEC_CASE_SENSITIVE_LOGON;

NAME                                 TYPE        VALUE
------------------------------------ ----------- ------------------------------
sec_case_sensitive_logon             boolean     TRUE
SQL>
SQL>

-- To change / Alter

SQL> ALTER SYSTEM SET SEC_CASE_SENSITIVE_LOGON = FALSE;

System altered.

Note: No down time require. No restart required. It is a random parameter.

Moving Table to different Tablespace

Moving Table to different Tablespace

-- Moving a Table from one tablespace to another
-- Reset minimum extents
-- Applies to Oracle Server - Enterprise Edition / Information in this document applies to any platform.


~ Syntax:
Alter table table_name move tablespace tablespace_name
(initial=64K minextents=1 maxextents=UNLIMITED);

e.g.,

alter table hr.employee_details move tablespace hr;
OR
alter table hr.employee_details move tablespace hr
(initial=64K minextents=1 maxextents=UNLIMITED);

Note: Some times wrongly a table may be created in different tablespace. To Manage all tables to be reside in respective owner tablespace, the above procedure can be followed.

Sep 28, 2013

Missing of Materialized view Indexes - leads performance issues

 When any Materialized view dropped and re-created, Indexes created on the materialized view should be taken care and re-created again. Otherwise, following query can be used to collect DDL scripts from source environment and run again if any index is missed during drop and re-create of materialized view.

-- All mview Index DDL - to generate GET_DDL script

select 'select dbms_metadata.get_ddl(''INDEX'',''' || INDEX_NAME || ''',''' ||
       OWNER || ''') from dual;' from all_indexes a where a.table_name in (
select v.MVIEW_NAME from all_mviews v )
and index_name not like '%PK%'

e.g.,
select dbms_metadata.get_ddl('INDEX','IDX_ID','HR') from dual;

--keep the above output and spool the output again for Create Script, 
eg.,

set heading off;
 set echo off;
 Set pages 999;
 set long 90000;
spool c:\temp\mvu_idx_ddl.log
select 'select dbms_metadata.get_ddl(''INDEX'',''' || INDEX_NAME || ''',''' ||
       OWNER || ''') from dual;' from all_indexes a where a.table_name in (
select v.MVIEW_NAME from all_mviews v )
and index_name not like '%PK%'
spool off;

Thanks
Hope sure you can collect DDL scripts from source database environment.

DBAsh.........njy.............. 

When to gather tables / Index stats?

~~When to gather tables / Index stats?
~~Applies to Oracle Server - Enterprise Edition - above Version: 10.1.x.x ( 10g/ 11g/ 12c)
Information in this document applies to any platform.

-- Drilling
-- Find stale stats Tables / Indexes in Oracle Database

sql >
SELECT * FROM ALL_TAB_STATISTICS
WHERE OWNER in('HR','PAYROLL','CRM','BILLING')
AND stale_stats='YES' and global_stats='TRUE';

Note: Use your required schema.

If the above query returns any table name, then statistics should be gathered immediatly to use plan to minimize the performance.

-- To gather statistics with indexes (all together)

select 'exec dbms_stats.gather_table_stats('''||owner||''''||','||''''||table_name||''''||','||'cascade => TRUE);'
from ALL_TAB_STATISTICS
where OWNER in('HR','PAYROLL','CRM','BILLING')
and global_stats='YES' and stale_stats='YES';

-- Find stale stats Index
select * from all_ind_statistics
WHERE OWNER in('HR','PAYROLL','CRM','BILLING')
AND stale_stats='YES' and global_stats='TRUE';

If any row will come, gather the respective table as per the follwoing example,

sql> exec dbms_stats.gather_table_stats('owner','table_name',cascade => TRUE);

Hope sure this document will help and you will have good performance in your production database.

DBAshhh...................njy............

Oracle Health Checkup Validity Engine/ Remote Diagnostic Agent (HCVE / RDA)

Health Checkup Validity Engine/ Remote Diagnostic Agent (HCVE / RDA)
~~~~~~~~~~~~~~~~~~~~~~~~~~~~~~~~~~~~~~~~~~~~~~~~~~~~~~~~~~~~~~~~~~~~~
About: RDA HCVE report:
Oracle RDA is a remote diagnostic agent, which is a tool that oracle usually asks you to run in order get a detailed view of your system and oracle configuration. I don't know what the -T hcve parameters do without checking the documentation, but from what I understand RDA just verifies and displays your current configuration and apparently found an issue with your account ulimits that are not set according to oracle recommendation.

I noticed that many DBAs are not aware of the need to run a prerequisite system check before installation of an oracle product. I wil suggest all DBA should run rda report and verify all reports as pre-check.

A) To generate RDA report
=============================
Step-1:  Install RDA software and keep in a mout point (min 1GB space required)
step-2:  Unzip RDA software          >> unzip rda.zip
Step-3:  give execute permissions     >> chmod chmod -R 775 xxx/xxx/rda
Step-4:  run rda.sh             >> ./rda.sh

Note: Read the requests, apply required option as per your availability and licencing. Nearly 60 to 70 options will be asked. if perl available, run perl script: rda.pl; perl -v to check perl is available or not

B) To generate HCVE report
=============================
 Enter into rda directory where rda.sh is available and run the following:

$ ./rda.sh -T hcve


Hope this will help a lot.

RMAN is hung or it is very slow / Clearing RMAN repository / Troubleshoot RMAN-06214 error

-- RMAN is hung or it is very slow
-- Clearing RMAN repository
-- Troubleshoot the issue
-- Troubleshoot RMAN-06214 error


RMAN>DELETE FORCE NOPROMPT OBSOLETE DEVICE TYPE DISK;

If RMAN-06214 still occurs, then try

RMAN>CROSSCHECK COPY OF CONTROLFILE;

allocate channel for maintenance type sbt;  -- as per your configuration set.
or
allocate channel for maintenance type disk;

rman> DELETE FORCE NOPROMPT OBSOLETE DEVICE TYPE SBT;
or
DELETE FORCE NOPROMPT OBSOLETE DEVICE TYPE DISK;

if not,

1) Cancel any Delete obsolete command sessions

2) RMAN>CROSSCHECK COPY OF CONTROLFILE;

3) Start the delete obsolete command with debug enabled to check whether RMAN is hung or it is very slow :

rman target / debug trace=debug1.trc log=rman1.log

RMAN> { your commands }

Upload to oracle, the debug1.trc and rman1.log for review.
Also upload the output of the below command :

RMAN> show all;

Note: Analyze the trace file or upload to Oracle support as a proactive measure.

Sample investigation :
~~~~~~~~~~~~~~~~~~~

--- When issue faced
--- As per my configuration setting

$export NLS_DATE_FORMAT="DD-MON-RRRR HH24:MI:SS"
$rman target / debug all trace=debug.trc log=debug.log
RMAN>set echo on;
RMAN>show all;
RMAN>CONFIGURE CHANNEL DEVICE TYPE DISK clear;
RMAN>CONFIGURE CHANNEL DEVICE TYPE 'SBT_TAPE' clear;
RMAN>allocate channel for maintenance device type sbt parms 'SBT_LIBRARY=oracle.disksbt, ENV=(BACKUP_DIR=/tmp)';
RMAN>crosscheck backup completed before 'sysdate -2' device type 'SBT_TAPE';
RMAN>delete force noprompt expired backup;
RMAN>list backup;

Caution : To configure / de-configure in RMAN in production database is to be verified first. To change/ run any command in production database is with your risk.

Generation of more archivelogs leads degrade of performance

When more archivelogs will generated in production database, this may degrade performance of your database. To avoid such issues, you need to increase redolog size and increase redo log groups based on transaction.

Note: No downtime required.

When more transaction will happen/ Commit / Rollback occurs, at that time huge redolog buffer will write and causes archive log generation. There are certain causes are there also.

-- Find no. of archivelogs in each hour:

set pages 1000
select trunc(COMPLETION_TIME,'HH') Hour,thread# , round(sum(BLOCKS*BLOCK_SIZE)/1048576) MB,count(*) Archives from v$archived_log
group by trunc(COMPLETION_TIME,'HH'),thread#  order by 1 ;

Myth# Per hour 5 to 10 log switch is OK for a database in OLTPs. Some authors describe 5 to 6 also.

If you are observing very high value for archive logs, then it may impact the performance. It may crash the instance also. So you have to increase the redo size. You can follow the following steps:

-- Find no. of redologs and size
select group#,members,bytes/1024/1024 "SIZE(MB)" from v$log;

-- Add redolog
alter database add logfile group 4 ('/oracle/oradata/prod/redolog4.log') size 200M;

---Adding Member (if required)
ALTER DATABASE ADD LOGFILE MEMBER '/oracle/oradata/prod/redolog4b.log' TO GROUP 4;

-- To resize exiting redo log group:
-- Online management

sql> alter system switch logfile;

-- If log is Inactive / not use, then

sql> alter database clear logfile group 1;

-- Do the following immediately

ALTER DATABASE DROP LOGFILE GROUP 1;

ALTER DATABASE ADD LOGFILE GROUP 1 ('/oracle/oradata/prod/redo01.log') SIZE 102400K reuse;

-- Rename redolog
ALTER DATABASE RENAME FILE '/oracle/oradata/prod/redolog4c.log' TO '/oracle/oradata/prod/redolog4b.log';

-- Listing all

spool log.lst
set echo off
set feedback off
set linesize 120
set pagesize 35
set trim on
set trims on
set lines 120
col group# format 999
col thread# format 999
col member format a70 wrap
col status format a10
col archived format a10
col fsize format 999 heading "Size (MB)"

select l.group#, l.thread#,f.member,l.archived,
l.status,(bytes/1024/1024) fsize
from v$log l, v$logfile f
where f.group# = l.group#
order by 1,2
/

-- Archivelog generation on a daily basis:


set pages 1000 
select trunc(COMPLETION_TIME,'DD') Day, thread#, round(sum(BLOCKS*BLOCK_SIZE)/1048576) MB,count(*) Archives_Generated from v$archived_log
group by trunc(COMPLETION_TIME,'DD'),thread# order by 1;

Cheers !!! Hope sure this document will help

DBAshhh...........njy....................

Sep 27, 2013

Oracle SQL Tuning advisor ( as suggested by ADDM report) - Oracle 10g / 11g/ 12c

If any query is coming in ADDM report to run Tuning advisor, then take the sql_id, snap_id and snap time duration and run the below blocks in sys user to get advisory details:

-- From ADDM report

Finding 1: Top SQL Statements
Impact is 6.89 active sessions, 47.16% of total activity.
---------------------------------------------------------
SQL statements consuming significant database time were found. These
statements offer a good opportunity for performance improvement.

   Recommendation 1: SQL Tuning
   Estimated benefit is 3.29 active sessions, 22.61% of total activity.
   --------------------------------------------------------------------
   Action
      Investigate the PL/SQL statement with SQL_ID "6p41vf1xqjtsy" for
      possible performance improvements. You can supplement the information
      given here with an ASH report for this SQL_ID.
      Related Object
         SQL statement with SQL_ID 6p41vf1xqjtsy.
         Begin p_addinvoiceappsnew(); End;
   Rationale
      The SQL Tuning Advisor cannot operate on PL/SQL statements.
................
................

-- By Example
Step: 1: Run the below block with giving appropriate parameter values.
-------------------------------------------------------------------------------------------
DECLARE
  l_sql_tune_task_id VARCHAR2(200);
BEGIN
  l_sql_tune_task_id := DBMS_SQLTUNE.create_tuning_task(begin_snap  => 898,
                                                        end_snap    => 899,
                                                        sql_id      => '6p41vf1xqjtsy',
                                                        scope       => DBMS_SQLTUNE.scope_comprehensive,
                                                        time_limit  => 60, -- use your snap duration of AWR/ADDMs
                                                        task_name   => '6p41vf1xqjtsy',
                                                        description => '6p41vf1xqjtsy');
  DBMS_OUTPUT.put_line('l_sql_tune_task_id: ' || l_sql_tune_task_id);
END;
/

Step: 2: Run the below statement to generate advisory / recomendations
-----------------------------------------------------------------------------------------------
EXEC DBMS_SQLTUNE.execute_tuning_task(task_name => '6p41vf1xqjtsy');


Step: 3: Run the below statement to see the advisory / recomendations details
------------------------------------------------------------------------------------------------------
SELECT DBMS_SQLTUNE.report_tuning_task( '6p41vf1xqjtsy') AS recommendations FROM dual;


Step: 4: At end delete the task as you created earlier
---------------------------------------------------------------------
exec DBMS_ADVISOR.DELETE_TASK('6p41vf1xqjtsy');


Hope this will help to get what steps to take for tuning for a query.

Note: Before apply any sql profile as suggested by Oracle tuning advisory, test the same in similar production environment using 11g RAT(Real Application Testing) feature. Otherwise don't apply the sql profile in production database. Take the ideas from the report and tune the query manually. As per my experience serious performance issues will come. If mistakenly applied in production environment, then drop the applied profile.   

Step:5:  Droping applied profile from applied database, if required/ if performing poorly

-- to find

sql> select * from dba_sql_profiles;
sql> exec dbms_sqltune.drop_sql_profile('sqlprofilename');

DBAshhh............njy...................

Resource manager plan verification - Fix : resmgr:cpu quantum

resmgr:cpu quantum

Application users called me and complain application performance is very slow and L2 users of database team found DB is slow.

After checking found the server load is very low, CPU/IO 90+ percent free. But many sessiones waiting on event “resmgr:cpu quantum”. From AWR we can see “resmgr:cpu quantum” is the TOP ONE and consuming 100% DB time:


resmgr:cpu quantum” means a session is waiting in a resource queue, wait until resource manager assign CPU pieces to it. Obviously we hit a resource manager's bug again.

If the "_resource_manager_always_on" oracle hidden parameter value is "TRUE", the the database will consume more CPU for their inter-plans which are required. If maintenance plan scheduled by DBA manually and DB environment is OLTP, then it can be off. It will improve the performance. But as it is hidden parameter can be set "FALSE" in production with Oracle's recommendation only.

Drilling the issue:
a) Verify the Parameter:
SQL> show parameter resource_manager;  

SQL> show parameter resource_manager;  

NAME                                              TYPE        VALUE
------------------------------------ ----------- ------------------------------
resource_manager_cpu_allocation      integer     2
resource_manager_plan                      string      SCHEDULER[0x318E]:DEFAULT_MAIN
                                                                         TENANCE_PLAN
b) To see the resource plan:
SQL>  select * from resource_plan_directive$;  -- See the output
Here sample example to see plan window counts:
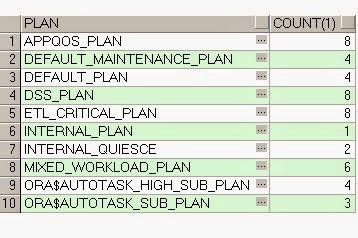
SQL> select plan,count(1) from resource_plan_directive$
group by plan order by 1;
output:


So many windows consuming CPU resource as it is on and doing some activities.

c) To turn off the resource manager:

$ connect / as sysdba
$ startup nomount
SQL> alter system set "_resource_manager_always_on"=false scope=spfile;
SQL> shutdown immediate
SQL> startup;

d) Check & Remove plan windoes ( Don't do without Oracle's recommendation)
SQL> select * from DBA_RSRC_PLAN_DIRECTIVES where plan = 'INTERNAL_PLAN';
SQL> exec dbms_resource_manager.create_pending_area();
SQL> exec dbms_resource_manager.delete_plan_directive('INTERNAL_PLAN', 'OTHER_GROUPS');
SQL> exec dbms_resource_manager.submit_pending_area();
SQL> exit


If:    Unable to open database: ora-600 [kskopen1] error found, then

Solution
1) Set this parameter in init.ora and startup again:

_resource_manager_always_on = FALSE

2) After database open run this query

SQL> set pages 999
SQL> select * from DBA_RSRC_PLAN_DIRECTIVES where plan = 'INTERNAL_PLAN';

The query should return only one row:
INTERNAL_PLAN OTHER_GROUPS CONSUMER_GROUP
0 0 0 0 0 0 0
0
FALSE

Other sessions at lower priority
YES

3) If in your case the query returns more than one row, remove the other rows, and set back
"_resource_manager_always_on"=true.

Click here to Read more about resource manager plan in 11g 

Caution: This is a hidden parameter change activity. This may harmful to your database. Do only with Oracle support's recommendation only. You can change with your own risk.

Cheers !!!

Sep 26, 2013

Fix : SMON process consuming more CPU time and degrading performance

~ Tested in Oracle 11gR2 environment

Issue Faced :

I met with unusual situation where a few users complained about query hanging. But the cause of this hang is not the size of table o (the size were rather small; 50000+ rows) or any kind of query plan change. 

We proceeded to check the locks and found the oracle process SMON was blocking as BLOCK column for V$LOCK showed 1 and with LOCK MODE 4. Further, LOGFILE SWITCH command was executed and the command did not return the prompt. There was no space issue either with TEMP tablespace or LOGARCHIVE destination. 

May be because of SMON locking, the transactions are getting locked. I also fired some random queries on some other table, but for me, the query returned results in usual time. Now, to prevent this situation from cropping up again, I wish to find the root-cause. What may be the possibilities that caused this SMON to block. Oracle was bounced and operation commenced normally. 

About SMON:

The system monitor process (SMON) is in charge of a variety of system-level cleanup duties. The duties assigned to SMON include:
  • Performing instance recovery, if necessary, at instance startup. In an Oracle RAC database, the SMON process of one database instance can perform instance recovery for a failed instance.
  • Recovering terminated transactions that were skipped during instance recovery because of file-read or tablespace offline errors. SMON recovers the transactions when the tablespace or file is brought back online.
  • Cleaning up unused temporary segments. For example, Oracle Database allocates extents when creating an index. If the operation fails, then SMON cleans up the temporary space.
  • Coalescing contiguous free extents within dictionary-managed tablespaces.
SMON checks regularly to see whether it is needed. Other processes can call SMON if they detect a need for it.

Solution :
If SMON process consuming more time in database, check if any role back entries are there or not. I am sure there are rollback entries set for the hidden parameter. Make it zero '0' to release database time spend on SMON process and improve the performance.

Note: Don't touch any hidden parameter in production environment without Oracle's recommendation.

-- Drilling: Collect below values for the given queries:
1) show parameter fast_start_parallel_rollback;
2) select name,value from v$parameter where name='fast_start_parallel_rollback';
3) select * from v$parameter where name like '%distributed_lock_timeout%';
4) select pid, program from v$process where program like '%SMON%';

FAST_START_PARALLEL_ROLLBACK:

SQL> show parameter fast_start_parallel_rollback;
Output : FALSE

This is one of the cause for which SMON consumed more resource. Make it HIGH or LOW. High is recommended in Production environments where more head room available for CPU/ Cores. Parameter setting FALSE will do serial recovery. Some environments FALSE is recommended also.

FAST_START_PARALLEL_ROLLBACK specifies the degree of parallelism used when recovering terminated transactions. Terminated transactions are transactions that are active before a system failure. If a system fails when there are uncommitted parallel DML or DDL transactions, then you can speed up transaction recovery during startup by using this parameter.
Values:
  • FALSE : Parallel rollback is disabled
  • LOW   : Limits the maximum degree of parallelism to 2 * CPU_COUNT
  • HIGH  : Limits the maximum degree of parallelism to 4 * CPU_COUNT
distributed_lock_timeout:
It specifies the amount of time (in seconds) for distributed transactions to wait for locked resources. Check the default value is set or not ( as 60 seconds). This can be verified as per your transactions and with oracle support. Here I found 60. It is ok for me.

Now Find SMON sessions:
SQL> select pid, program from v$process where program like '%SMON%';
I found more sessions. i.e., Sessions are trying to recover. SMON is doing more house keeping activities. If any transaction session is killed or stopped at middle, this situation may occur. I did the following and found good performance in next restart.

Set "_cleanup_rollback_entries":

SQL> alter system set "_cleanup_rollback_entries"=0 scope=spfile sid='*';

After setting this, Database must be bounced.

Hope your performance may improved. Default value for  "_cleanup_rollback_entries" parameter is 100. But don't change if there is no SMON recovery issues in your environment. Must be changed with Oracle support consultation. AS per one of my prod env. requirement I changed to 400 also to speedup recovery for dead transactions.

To see hidden parameter  and value set in your database:

SELECT a.ksppinm  Param,

       b.ksppstvl SessionVal,

       c.ksppstvl InstanceVal,

       a.ksppdesc Descr

  FROM x$ksppi a, x$ksppcv b, x$ksppsv c

 WHERE a.indx = b.indx

   AND a.indx = c.indx

   AND a.ksppinm LIKE '/_%' escape '/'

 ORDER BY 1;


Note: Do above with your own risk. Best option is raise SR with Oracle support and follow the recommendations.

DBAshhh.........njy......

Translate >>